University of Illinois at Urbana-Champaign logo.
OSG Logo

Home Projects Group News References Funding


OPET: Optical Power Extinction Tomography

Overview Experiment Results Updates

Results:

Preliminary data collection:

This preliminary data shows a Moiré pattern whose frequency is that of the grating minus the frequency of the interference produced by the two laser beams projected onto the grating. To get a Moire pattern of zero frequency we calculated the grating angle needed to be 35.46 degrees which agreed with the experimental results. Click on the image below to see an animated gif showing the grating being swept from an angle of 32.46 degrees to an angle of 38.46 degrees through this zero frequency. The experiment contained an 8 line/mm grating and the angle between the incident beams was 0.5 degrees.
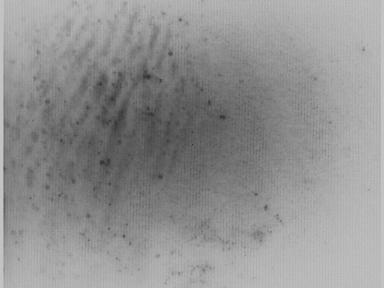
Animated GIF of Fringes
(This animated gif is 6.8MB)

Grating Data (January 20th 2004):

The following images represent raw data that was remapped into the Fourier plane. The inverse Fourier transform of this would show the 2-D slice through the scattering object, in this case the grating.  The data was taken using a single detector and represents 24 beam separation angles and 130 sample angles.

Intensity View of Fourier Plane Data

Surface View of Fourier Plane Data


Home Projects Group News References Funding

Beckman Institute CSL
ECE logo