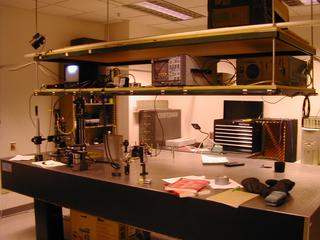
The OPET lab in CSL |
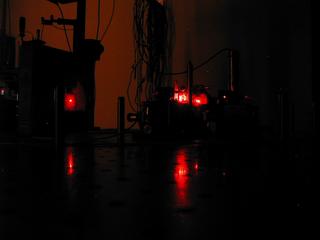
Laser Illuminating the Interferometer in the Dark
|
Experimental Overview:
To demonstrate the principles
behind Optical Power Extinction Tomography we designed an experiment
consisting of two coherent collimated beams that intersect within an
object of interest. One beam is held fixed while the other rotates
around the first (control) under computer control; the sample angle can
also be controlled. Mechanical control of the angular separation of the
beams is limited to a two-dimensional (2-D) plane, thus the current
system is only capable of imaging 2-D objects.
As shown in the following figures, the source for this experiment
consists of a HeNe laser which is split using a non-polarizing beam
splitter and finally coupled into two polarization preserving fibers.
|
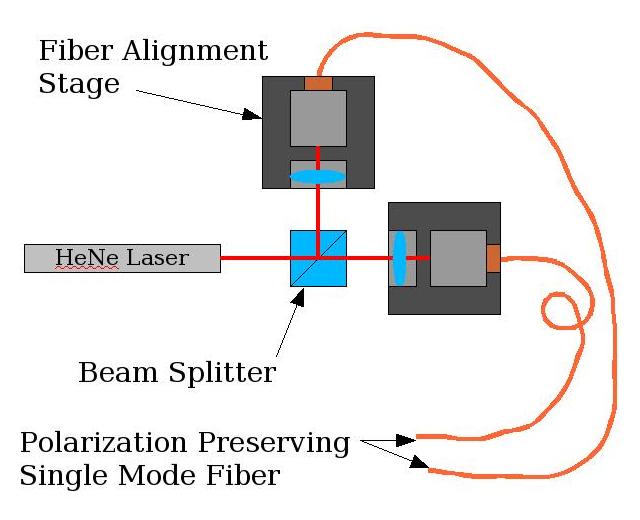
Illustration of how we couple light into the fibers.
|
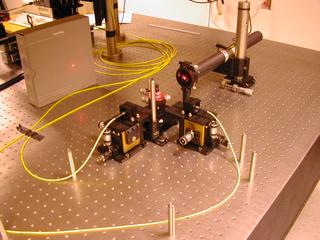
Actual picture of coupling the HeNe into fibers.
|
|
|
What is not shown in the figure that is in the picture is a quarter
wave plate used to create circularly polarize light coming from the
laser; the laser is linear. This was done to save the cost of
adding fiber rotators to the fiber alignment stages, it was assumed that
the polarization preserving fibers would pick their preferred state of
polarization from the circularly polarized beams. In hindsight this was
a bad idea since not only do the the fibers pick their preferred state,
they also allow other states to propagate randomly, which translates
into fringe visibility fluctuations in the interference pattern. It is
planned that the fiber rotators will be added in the near future to
avoid these problems.
The fibers are routed to two beam towers as shown below. The paths each
fibers takes is designed to stress this fiber as little as possible.
|
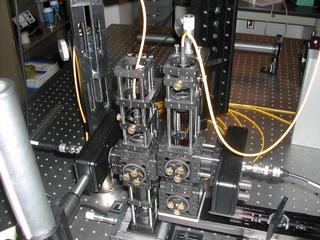
Fiber tower for each arm of the interferometer, the light
from each tower is recollimated into 10 cm beams with
a pair of aplanat lenses.
|
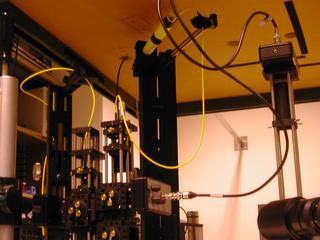
Fiber routing
|
While both of the two beam towers serve to recollimate the light coming
from each of the two fibers and deflect the collimated beams
horizontally across the sample, they also serve unique functions. The
stationary tower (the outer tower or Arm I) has a piezo translation
stage that is used to change the path length difference between the two
beams and is controlled with the computer. The rotating tower (the inner
tower or Arm II) is mounted on a Newport rotation stage allowing
the angular separation to be adjusted between the two beams. At first
small angles were to be ignored because of the occlusion caused by the
towers, but it became clear that very large angles would make it very
challenging to acquire data. The towers were then modified by replacing
the lower mirrors with beam splitters to remove the occlusion at small
angles. However, there are still certain angles were occlusion occurs
but with the current system there is very little that can be done to
completely eliminate it. The following two figures show the general
structure of a beam tower as well as the general assembly of the rest of
the experiment.
|
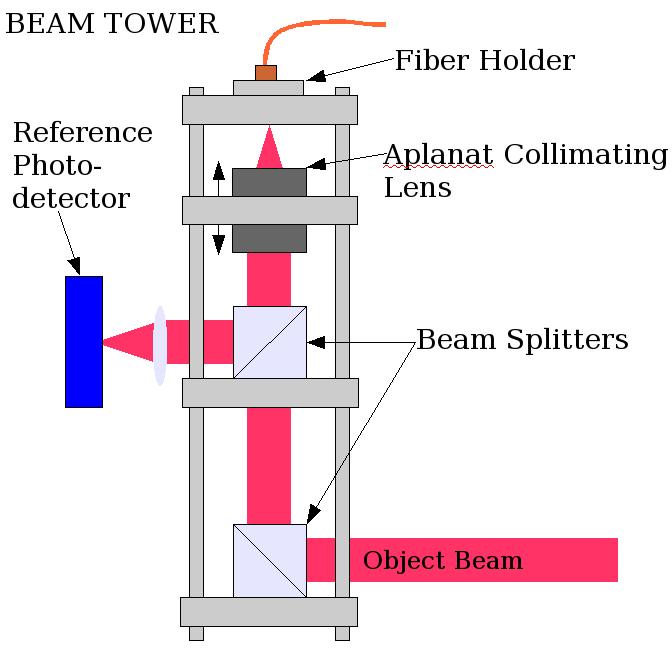
Illustration representative of a beam tower. Note the
photo detector used as a reference to cancel any
signal fluctuations from the fiber and laser.
|
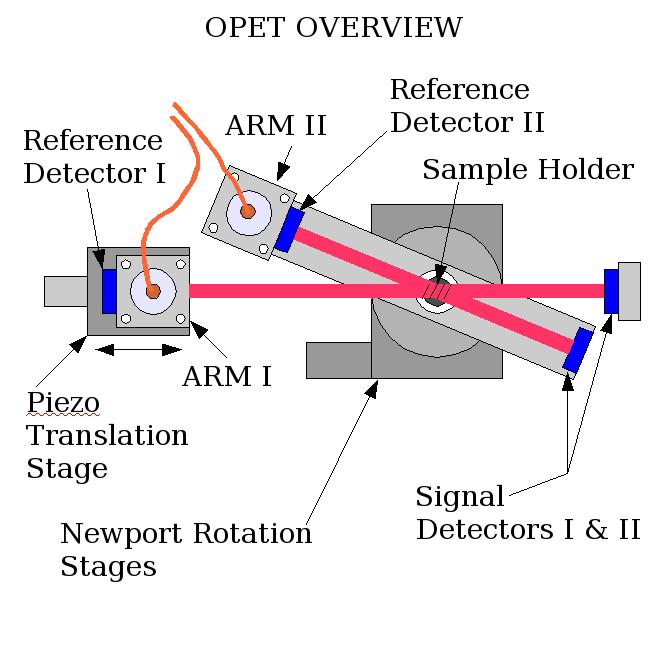
Schematic of the system showing the towers and
beam path as well as the sample location. This is
shown in the large angle configuration.
|
|
|
Note that the sample holder is also mounted on an identical Newport
rotation stage that is positioned below and coaxial with the first since
this is the precise location where the two beams intersect. Not shown in
the schematic is a second beam splitter at the end of Arm II that allows
light from Arm I to pass through for small angles and be detected with a
photo detector.
There are 4 photo detector assemblies that make up our system. They
include a reference detector and signal detector on each arm. Measuring
the signal both before and after the sample allows for true power
extinction measurements to be made. Each detector assembly
consists of lens, a pinhole, and a photo diode. The lens and pinhole
(~5microns) effectively form a spatial filter allowing only the DC
component of the forward propagating beam to be detected. Each detector
is connected to a channel on a Tektronics (5???) mainframe oscilloscope,
which is in turn connected via GPIB to a data acquisition computer.
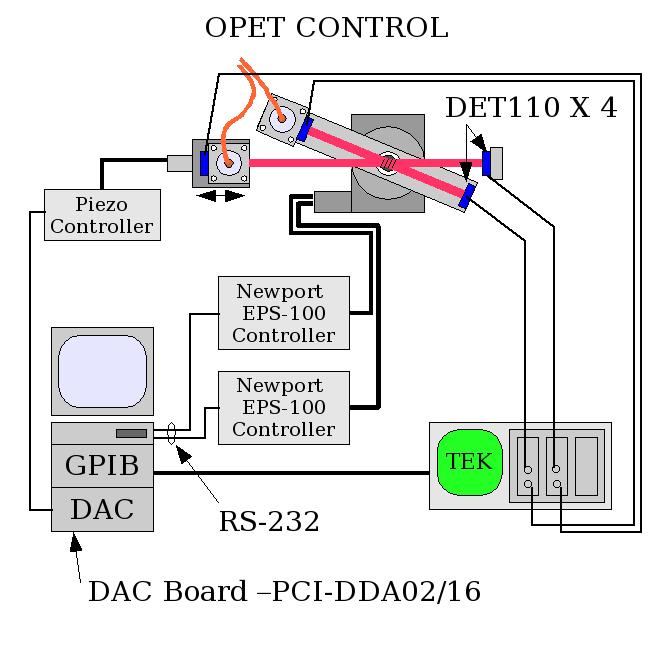
To control this experiment we are using an Intel based PC running
Mandrake Linux 9.0. The PC has a Computer Boards PCI-DDA02/16 data
acquisition board as well as a Computer Boards PCI GPIB board. The
following figure shows the general control layout for the system.
|
|
The control for this experiment uses an Intel PC with a Computer Boards
PCI-DDA02/16 data acquisition board as well as a Computer Boards PCI
GPIB board. The DAC board is used to control the position of the piezo
stage. The piezo stage has a controller with closed loop feedback and
accepts 0 - 10Vdc input to set the position from 0 - 20 microns. The
GPIB board is used to communicate with the Tektronics scope. The Newport
controllers communicate with the PC using the standard RS-232 ports
(COM1 and COM2). |
|
|
The software used for control is
an application written at the University of Illinois called
Imagekitchen.
|
